I open to file caused a confusion for various people
I frequently face to questions of some geoenvironments about how progressed for a landpart on hydraulic principles of groundwater.I must say that they are very very right for this questions.Because,subject "big confusion cond" on this chapter.Generally,my reference point for chapter is section of hydraulic gradient handled during pumping tests;
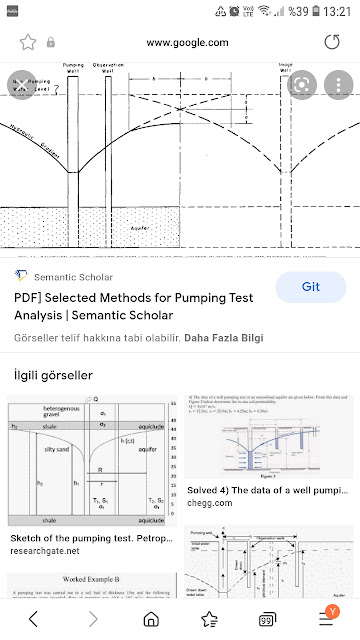
Yes,hydraulic gradient information of section is a 'mind opener' for solution of chapter(informations about mean of hydraulic gradient maps of various person are very low quality.You are right!I sign to weird a infogap for descriptions as hydraulic dev of this type gradient distribution maps.Thus,You have a mind clearer for means considering gradient contours of this hydraulic gradient information handled during pump test👍)
Also,I know to problem for "focus headline" of various geoenvironment about chapter based on Geophysics application😌At this point,I will suggest focusing to puclications about GROUNDWATER VULNERABILITY of 'VES approach literature' as visual sources👍
So,shortly,you know to some publications as hotspot contour distribution examples of contamination for lands as coastal aquifers!As similar this examples but handling distribution cones by inverse logic👍This logic says - as environmental contamination/impact with + as production well of inner cone contour distributions,+ as environmental contamination/impact with - as production well of outer cone contour distributions👍(Or inverse on your map legend description)
Where,you understand to caused to why problem for production aims of hydraulic cumulation hotpsots on this logic(Thus,explained as technic cond expressed as 'very weird' by some geoenvironemnents of chapter👍👍👍)
Alright,How to approaches of easiest hydraulic gradient mapping?
I summaried as 'short but effective' all realities about streamplot chapter at mainlink connected this link! But,I say to information disabilities of some geoenvironments as a startpoint about vectoral description of hydraulic gradient.Thus,I share a reference presentation;
https://youtu.be/HDtTusiX-Oc
You are right!Perfect presentation of 2D vectoral explanation on a datum level of two point👍
At this point,A reference "groundwater level contour map" via dataset produced(for example,by vertical electrical sounding) for hydraulic condition!!!You can establish vectoral hydraulic gradient distribution on your capabilities after this step
You are right!Where,I expressed procedure stru. about "groundwater level contour map" qualified based on VES literature of geophysics as reference of powerful a dataset established with some advantages👍So,You extract a "groundwater level contour map "qualified as conclusion of analysis of this dataset(Especially,I must say that no any explanations about this step by various pdf source
😐).This map summaries very powerful a stru. on a comparison to maps established with literature informations of other disciplines.
I mentioned for opensource programming solutions about step after groundwater level contour map.By the way,Subject some info-requests for such a role of gradient function of numpy...Thus,I share a link about numpy.gradient;
https://stackoverflow.com/questions/56046811/how-make-a-correct-gradient-map-using-numpy-gradient
At this point,I remembered some inforequests about role of DEM data.Distribution map produced via hydraulic gradient formulation of DEM data presents a gradient distribution as related to surface hydrology.
This approach is not a fix method for groundwater gradient distribution!Unfortunately,subject environments acted with a approach as reflected groundwater gradient of gradient related to surface hydrology!!!

Yorumlar
Yorum Gönder