A unsupervised classification application on Satellite Data with Python
Steps:
1)Producing a folder at Desktop
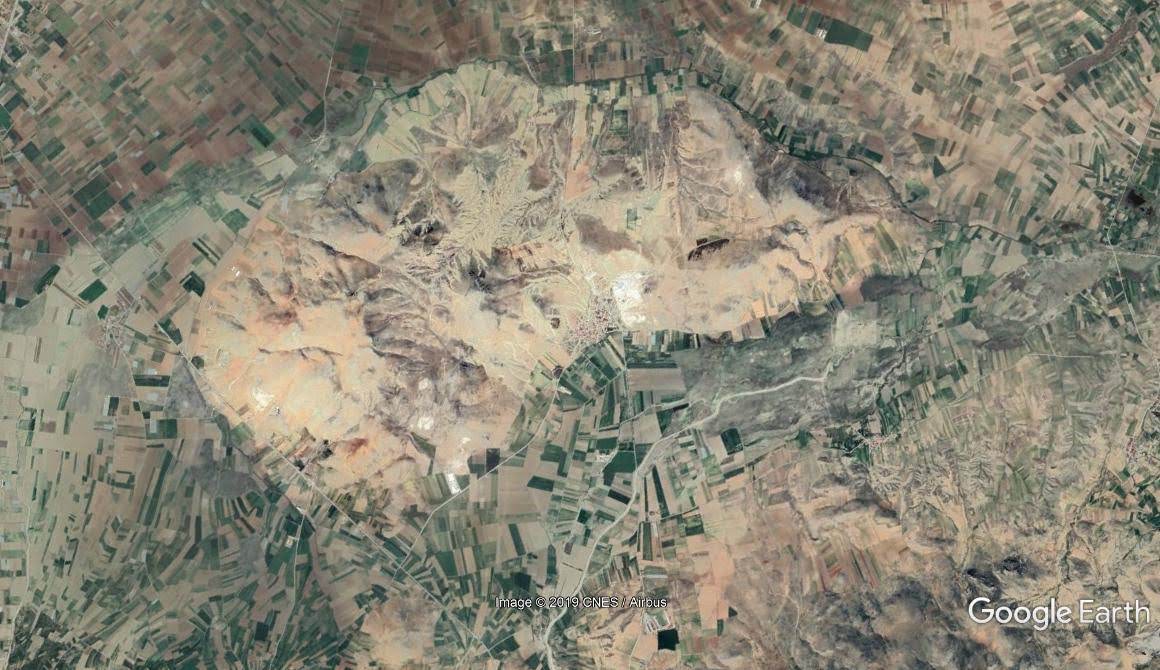
2)A image catching via Google Earth as example and recording into this folder (Test.tif as example)
Test.tif example:
DESCRIPTION OF PROGRAM:
You need GDAL, Numpy and Sklearn. If you wish to see the data you will also need Matplotlib.
Start with a single band image
import numpy as np
from sklearn import cluster
from osgeo import gdal, gdal_array
import matplotlib.pyplot as plt
# Tell GDAL to throw Python exceptions, and register all drivers
gdal.UseExceptions()
gdal.AllRegister()
# Read in raster image
img_ds = gdal.Open('test.tif', gdal.GA_ReadOnly)
band = img_ds.GetRasterBand(2)
img = band.ReadAsArray()
print (img.shape)
X = img.reshape((-1,1))
print (X.shape)
k_means = cluster.KMeans(n_clusters=8)
k_means.fit(X)
X_cluster = k_means.labels_
X_cluster = X_cluster.reshape(img.shape)
print (len(X_cluster))
Plot the classified image
plt.figure(figsize=(20,20))
plt.imshow(X_cluster, cmap="hsv")
plt.show()

What about using all 13 bands of Sentinel 2?
import numpy as np
# Tell GDAL to throw Python exceptions, and register all drivers
gdal.UseExceptions()
gdal.AllRegister()
# Read in raster image
img_ds = gdal.Open('test.tif', gdal.GA_ReadOnly)
img = np.zeros((img_ds.RasterYSize, img_ds.RasterXSize, img_ds.RasterCount),
gdal_array.GDALTypeCodeToNumericTypeCode(img_ds.GetRasterBand(1).DataType))
for b in range(img.shape[2]):
img[:, :, b] = img_ds.GetRasterBand(b + 1).ReadAsArray()
new_shape = (img.shape[0] * img.shape[1], img.shape[2])
print (img.shape)
print (new_shape)
X = img[:, :, :13].reshape(new_shape)
print (X.shape)
Now fit it
k_means = cluster.KMeans(n_clusters=8)
k_means.fit(X)
X_cluster = k_means.labels_
X_cluster = X_cluster.reshape(img[:, :, 0].shape)
And plot
import matplotlib.pyplot as plt
print (X_cluster.shape)
plt.figure(figsize=(20,20))
plt.imshow(X_cluster, cmap="hsv")
plt.show()

Changing the classification is straight forward. In this example choose MiniBatchKMeans
MB_KMeans = cluster.MiniBatchKMeans(n_clusters=8)
MB_KMeans.fit(X)
X_cluster = MB_KMeans.labels_
X_cluster = X_cluster.reshape(img[:, :, 0].shape)
Plot the result
plt.figure(figsize=(20,20))
plt.imshow(X_cluster, cmap="hsv")
plt.show()

Final save the result to a bew geotiff
from osgeo import gdal, gdal_array
## write out to tiff
### single band raster.
ds = gdal.Open("test.tif")
band = ds.GetRasterBand(2)
arr = band.ReadAsArray()
[cols, rows] = arr.shape
format = "GTiff"
driver = gdal.GetDriverByName(format)
outDataRaster = driver.Create("sonuc.gtif", rows, cols, 1, gdal.GDT_Byte)
outDataRaster.SetGeoTransform(ds.GetGeoTransform())##sets same geotransform as input
outDataRaster.SetProjection(ds.GetProjection())##sets same projection as input
outDataRaster.GetRasterBand(1).WriteArray(X_cluster)
outDataRaster.FlushCache() ## remove from memory
del outDataRaster ## delete the data (not the actual geotiff)
Thus,a sonuc.gtif at your folder will produce;
And,conclusions of compilation as a whole;


Yorumlar
Yorum Gönder