A example of Curvature Ploting to SWEPAM data for more clear evaluations
There are some problems about evaluations via Potsdam data format for analysis of SWEPAM data.I present base curvature plots for more clear evaluations.Where,you can analysis to Geophysical Phenomenas as Earthquake Events via considering to Astronomic and Solar event records as popular

Especially,I suggest for Geophysicists as powerful that about focalising to displacement characteristics on zero axis of Bz and Bt parameters...
--------------------------------------------------------------------------------------------------------------------------
There are some example requests...Unfortunately,a necessity to especial time requirement for SWEPAM apk data.So,concentrating to only this field for following to service times is requiring...
Upper examples that carrying-out for a time range as applicable as individual(you already evaluate that expressed of specific part of day).Though to this,I realised to explaining on some parameters for Bt Bz curves in May.

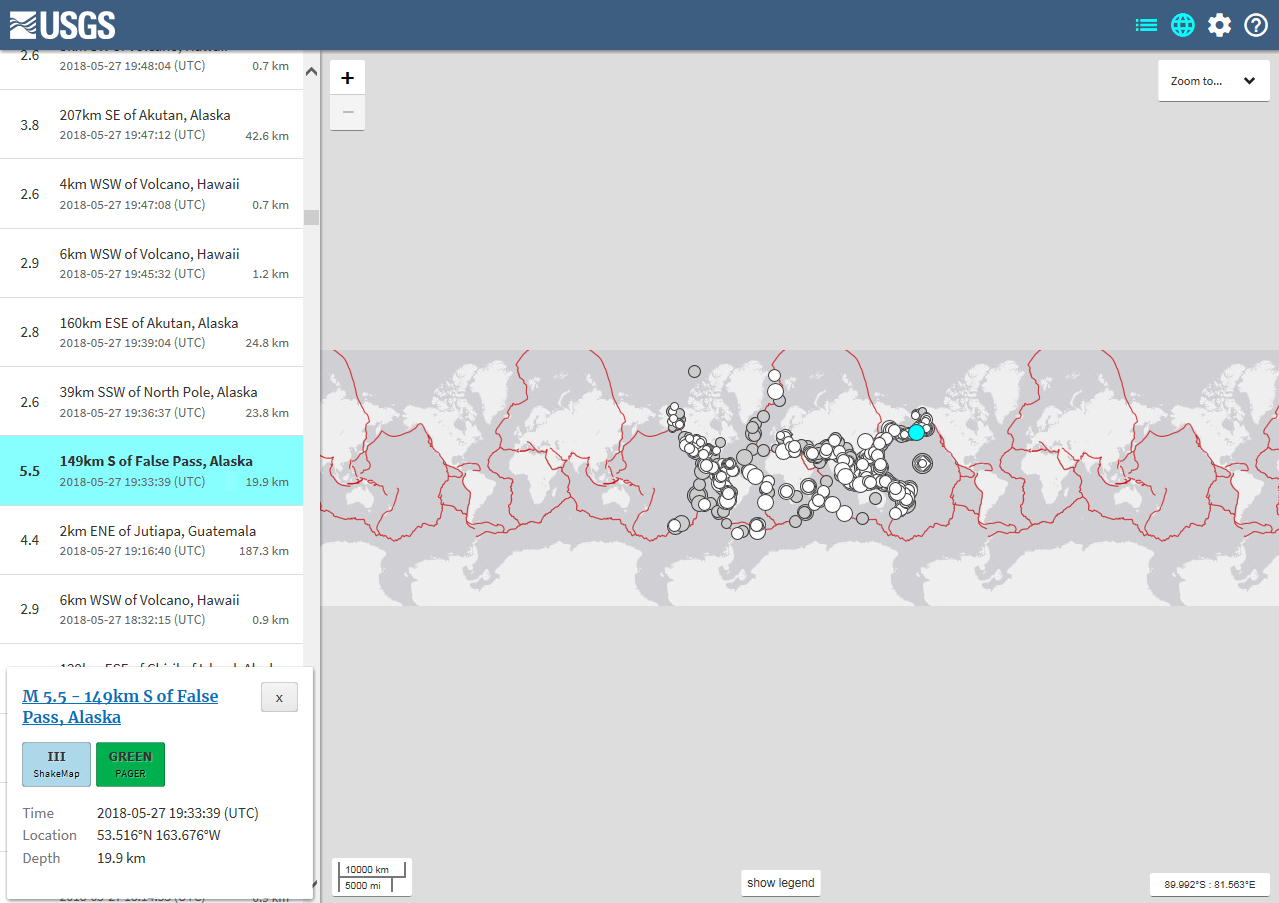
I evaluate USGS catalogue for May 2018.(Special thanks to USGS data)


In curves,Bt Bz presentation that quite powerful to understanding to Anatomies of Big Earthquakes.(patterns of Bt and Bz curves by horizons are interesting as first).Next,Monthly KP index specifications that other powerful implication...And,you must evaluate to important planetary events.
Conclusion on Methodology:Perfect Corelation by up-presentation!
I again expressing that Big Earthquake Events are expressing as clear.But,special interest for following chapter a requirement...
--------------------------------------------------------------------------------------------------------------------------

Yorumlar
Yorum Gönder