How producing a powerful spectrogram based on .wav file?Role of pylab and critic chapter about NFFT parameter
Producing a spectrogram using .wav file is easy with python program codes.Where,I can express established more selective a stucture by other spectrogram modules considering chapter as manuel parameters of spectrogram solution presented of pylab!!!
Informations about source .wav file;
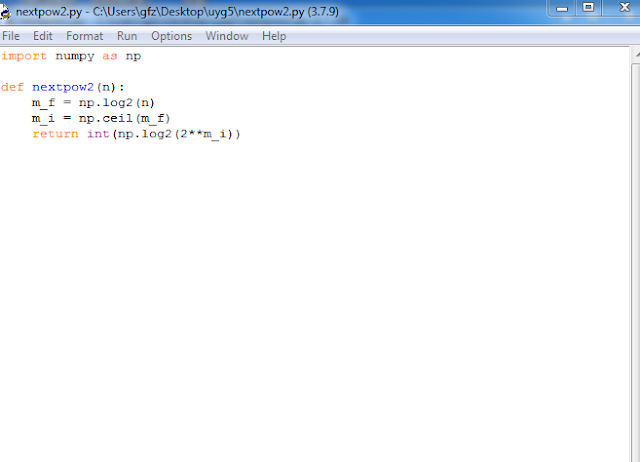
Subject solution established of sub-program as observed at main program based on [ln 3].But,this value is not producing conclusion as character q for NFFT value related of specgram code...In this point,I carried-out a manual control for numeric value established minimum NFFT value...As conclusion,observed minimum structure of 128 value!!!Also,I especially express reflected a strucuture as ~ 1024 of NFFT value at original code part as different from this program.So,x8 by Minimum value...You are right!!! This condition is signing to big corelation with ln[3] code part!
On this informations,I will wait suggestions about established how a character solution on NFFT parameter.
By the way,I especially ephasize to "JOKER" condition for user of specgram code!!!So,you have to conclusions for advanced processes about frequencies,bins and im with power spectral density(PSD) vector matrix;


Yorumlar
Yorum Gönder